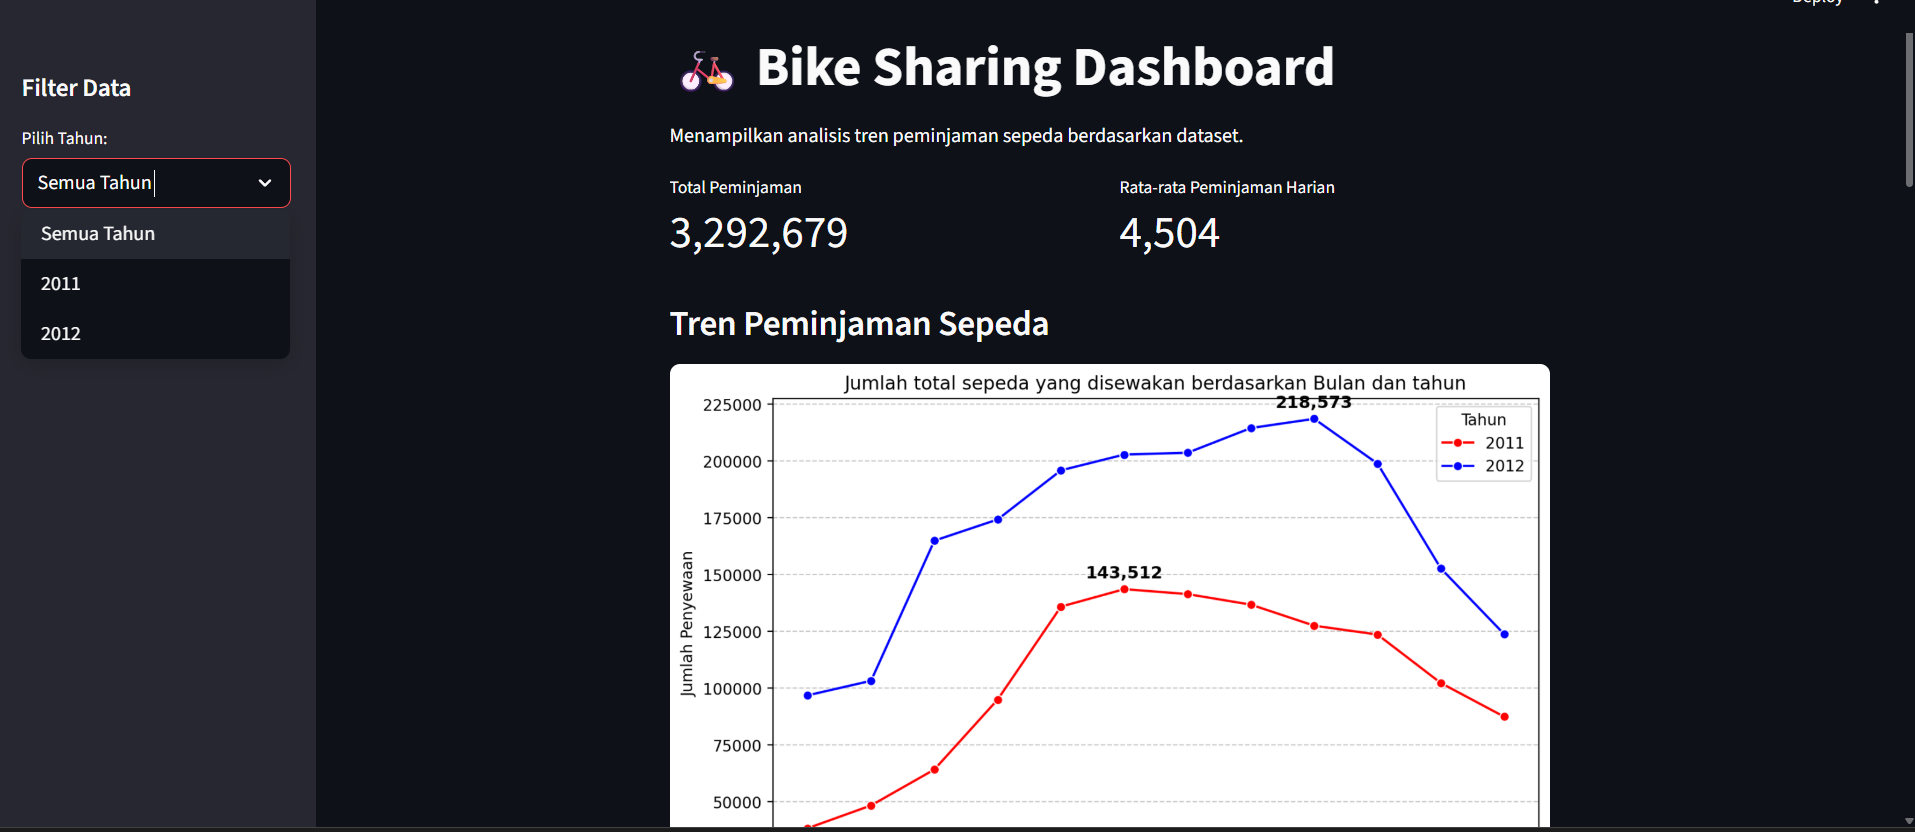
Bike Sharing Analysis Dashboard
A data analysis and visualization project for bike-sharing usage, built with Python, Pandas, Seaborn, and Streamlit. This interactive dashboard presents bike rental trends based on various factors such as months, humidity, wind speed, and rental hours.
StreamlitAnalysisMatplotlib